Metric Details and Trends
Overview
Validate your metric by understanding its value and impact over time, its variability and sample size, and how it differs across dimensions using the Impact snapshot chart.
Feature flag Metric impact tab
You can click View more on a metric card in the Metrics impact tab to understand its trend over time and statistical information. In addition, you can:
- Review the Impact snapshot chart for an up-to-date, aggregated view of the expected impact over baseline for each treatment and an estimated range for that impact
- Select more treatments, to compare the impact against the baseline in the Impact over time chart
- Review the aggregated metric value for all treatments in the Values over time chart
The charts and tables are reflective of what you preselect within the Metrics impact tab, such as the feature flag version, targeting rule, treatment, and baseline chosen for comparison.
Accessing metric line charts and tables
To access metric line charts and tables:
- From the left navigation panel, select Feature flags.
- In the Feature flags panel, select your desired feature flag.
- Click the Metrics impact tab in your feature flag.
- In the Key metrics area, click the metric you want to analyze.
- Select the desired chart to review.
Metric metadata
The metric meta section displays the meta information associated with that metric such as owner, tags, and description.
Line charts
You can view line chart data for a feature flag version. Hover over a point on the line chart to update the values in the table.
Before analyzing line charts, make sure the filters you are interested in are applied on the feature flag Metrics impact tab (e.g., the feature flag version, targeting rule, or baseline).
Viewing impact snapshot
The Impact snapshot chart shows an up-to-date, aggregated view of the expected impact over the baseline for each feature treatment (variation) and an estimated range for that impact.
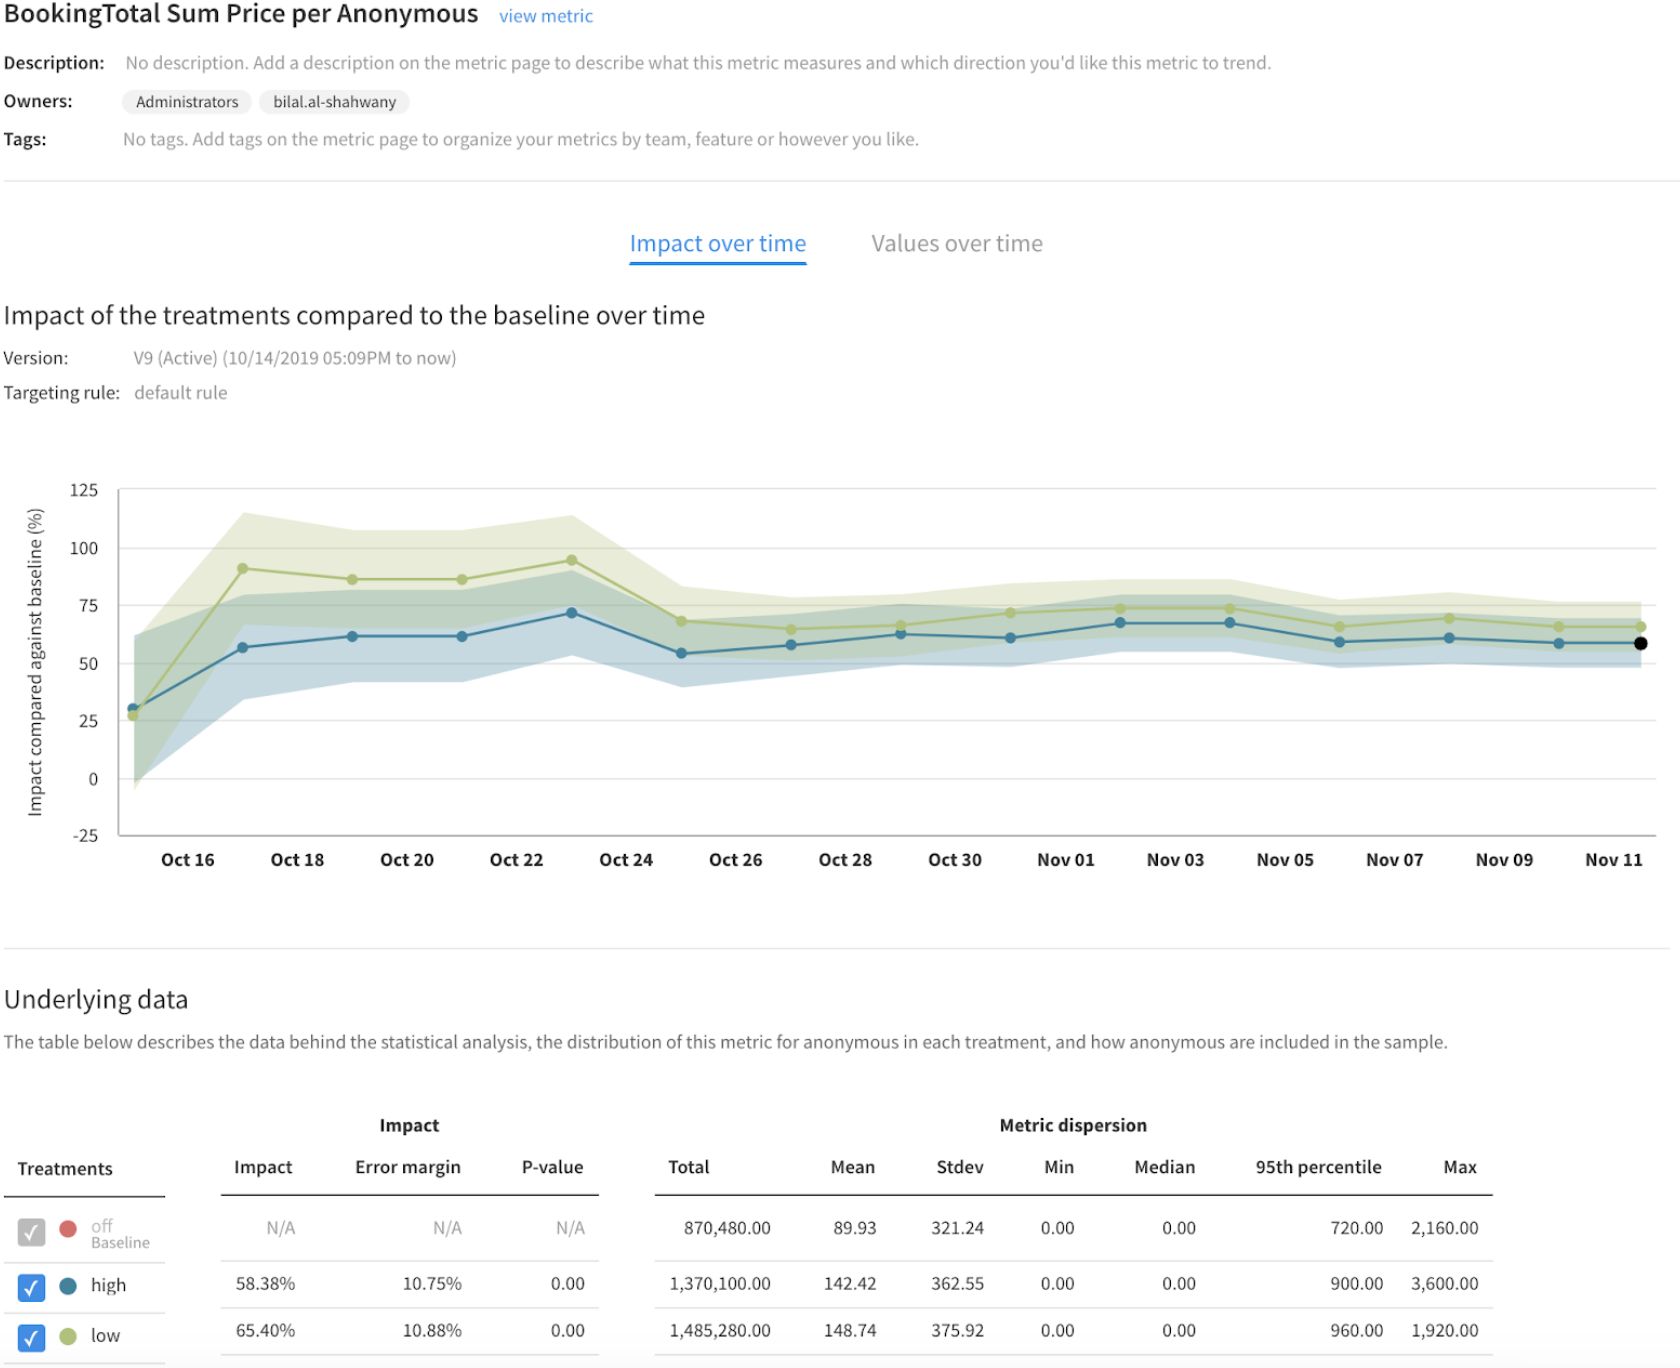
Viewing impact over time
The Impact over time chart allows you to visualize the aggregated value of the metric in each treatment of a feature flag. The chart represents the cumulative impact and is based on all the data Harness FME has received up until the last calculation update. You can hover over a point on the chart to update the values in the table.
To view impact over time:
-
Select a baseline treatment on the Metrics impact tab.
-
Select treatments for comparison in the underlying data table.
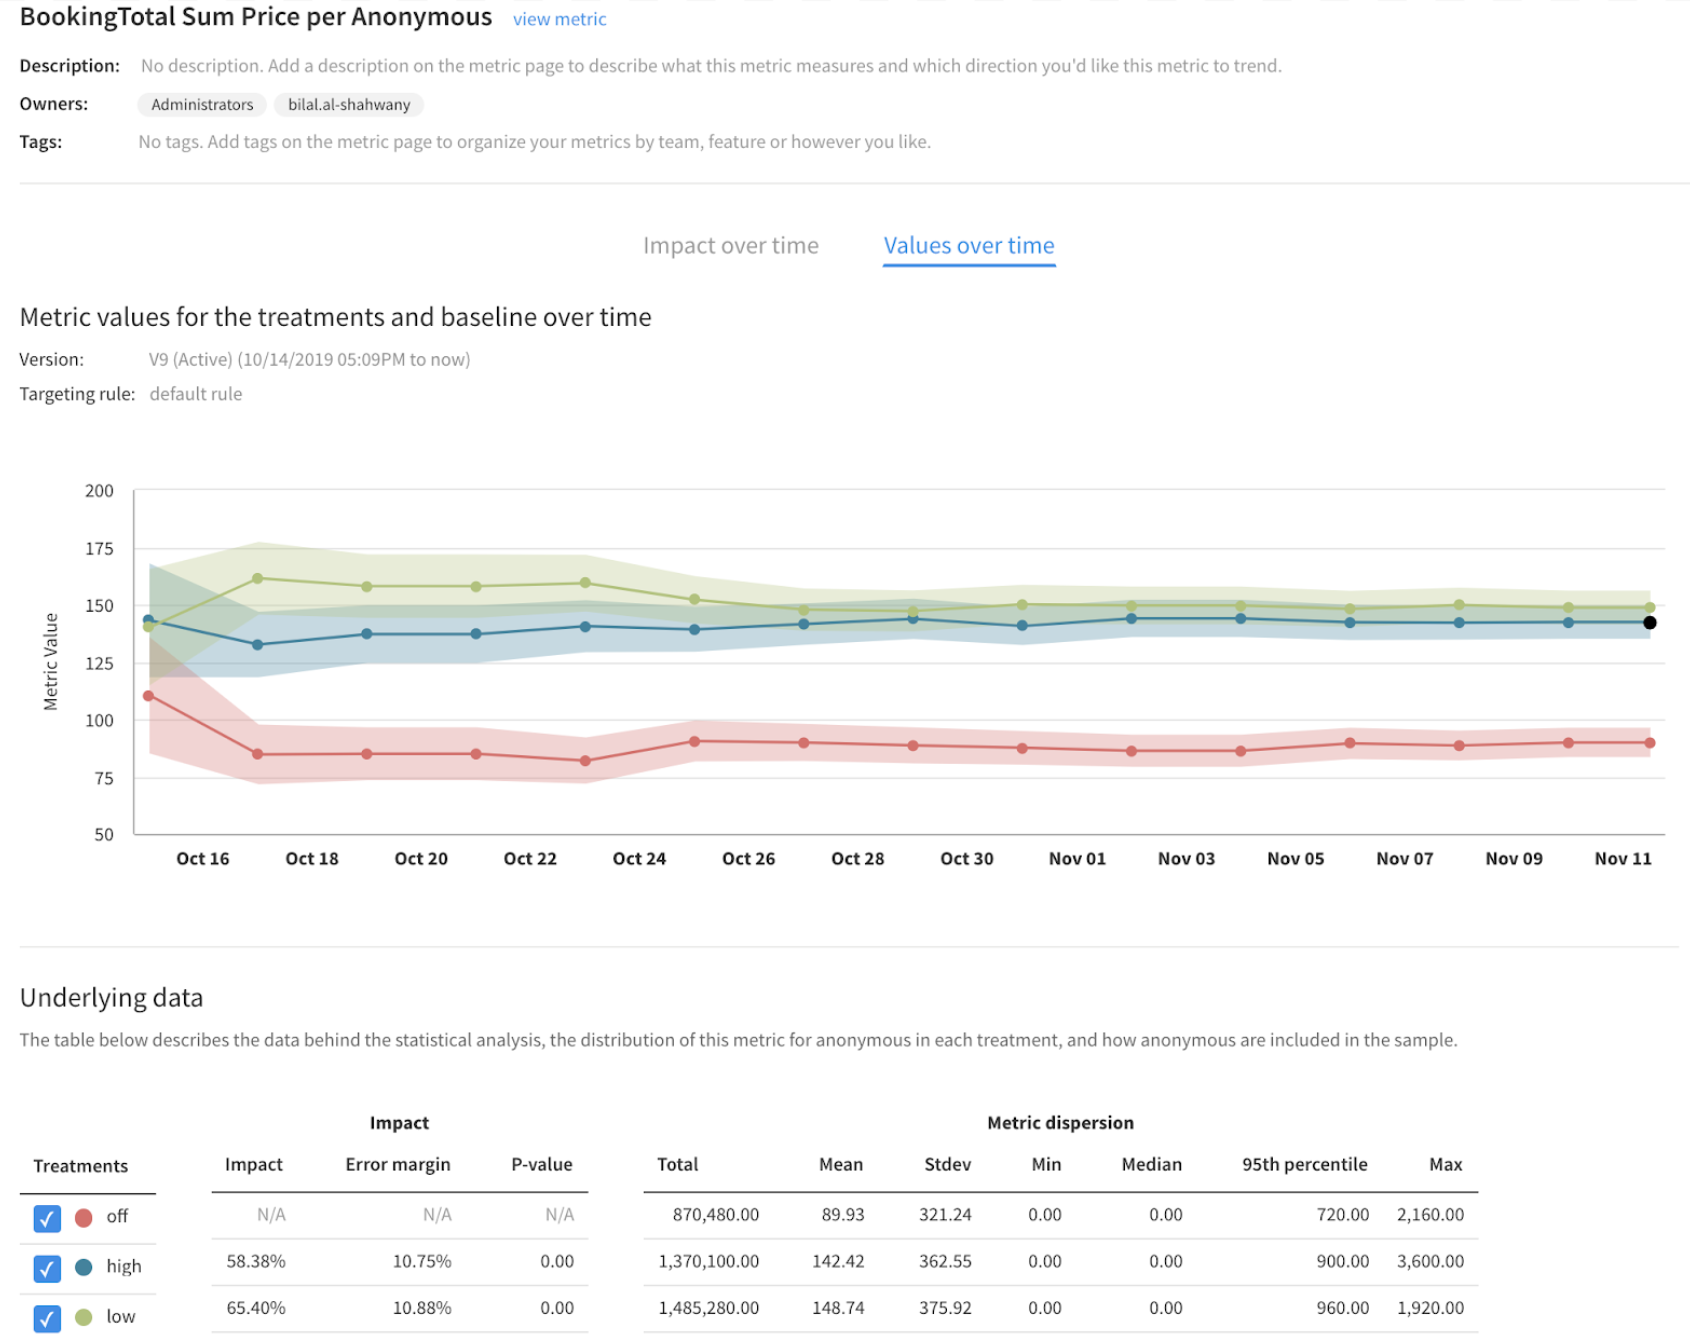
Viewing value over time
The Values over time chart allows you to visualize the average value of the metric for each treatment of your feature flag. You can also view how the estimated range of the metric value has changed over time.
Metric tables
The following section describes the tables shown on the metric details page below the three time charts.
Impact
All criteria are necessary and sufficient to view your data when you select a treatment and a baseline treatment. A statistical comparison is made with the analyzed metric. A description of these columns are shown below.
| Title | Description |
|---|---|
| Impact | The relative impact between the treatments you are comparing. |
| Error Margin | The chance (dependent on your account's default significance threshold) that the interval between the mean +/- the error margin contains the true metric value. |
| P-value | The probability of seeing a result at least as extreme as the result we observed, if the null hypothesis were true. |
Viewing metric dispersion
The information displayed within the metric dispersion section of the table is dependent on the type of metric you are analyzing. When available, you can understand the minimum, maximum, median, and the 95th percentile of your metric. The metrics dispersion allows you to measure the spread of your data, or the variability in your sample. This section also includes the absolute total contributing to the metric value. For example, if you are measuring the count of purchases per user, you can see the actual count of purchases in each treatment and the uplift between the treatments. The table below highlights which columns is available based on the type of metric you are analyzing and those which show as N/A.
| Total / Average / Contributors | Mean | Stdev | Min | Median | 95th Percentile | Max | |
|---|---|---|---|---|---|---|---|
| PER USER | |||||||
| Count of events per user | yes | yes | yes | yes | yes | yes | yes |
| Sum of event values per user | yes | yes | yes | yes | yes | yes | yes |
| Average of the event values per user | N/A | yes | yes | yes | yes | yes | yes |
| Ratio of two events per user | N/A | yes | yes | yes | yes | yes | yes |
| Percent of unique users | yes | yes | N/A | N/A | N/A | N/A | N/A |
| ACROSS USERS | |||||||
| Count of events | yes | N/A | N/A | N/A | N/A | N/A | N/A |
| Sum of event values | yes | N/A | N/A | N/A | N/A | N/A | N/A |
| Average of event values | yes | N/A | N/A | N/A | N/A | N/A | N/A |
| Ratio of two events per user | yes | N/A | N/A | N/A | N/A | N/A | N/A |
| Count of unique users | yes | N/A | N/A | N/A | N/A | N/A | N/A |
| Title | Description |
|---|---|
| Mean | The mean is equal to the sum of all the data points in the data set, divided by the number of contributors in the data set. |
| Stdev | The standard deviation represents the variance of the data set as compared to the mean. |
| Min | The smallest data point in the data set. |
| Median | The midpoint of the data set. |
| Max | The largest data point in the data set. |
| 95th percentile | 95% of the time, the metric value is at or below this value. |
Sample population
This section of the table provides information about the metric's sample population. A description of these columns are listed below:
| Title | Description |
|---|---|
| In treatment | The number of unique user keys that were served a treatment, and in some cases sent an event measured by the metric. |
| Excluded | The number of unique user keys excluded from the analysis. For more information, see the Exclusions section in Attribution and exclusion. |
| Sample size | The number of unique user keys remaining in the sample after exclusions. |
In most cases, the In treatment value equals the number of user keys that were served a treatment. However, there are some metric definition settings that cause the In treatment value to be less than the number of user keys that were served a treatment. (Consequently Sample size would also be less.) These metric definition settings are explained below.
-
For a metric measured as Average of event values, user keys that did not send the event are not included in the metric calculation. Thus, they would not be counted in the In treatment value, even though they may have been served the treatment.
-
For a metric measured as Ratio of two events, user keys with a zero dominator (event count) are not included in the metric calculation. Thus, these user keys would not be counted in the In treatment value for this metric, even though they may have been served the treatment.
-
For a metric with a Has done the following event filter (in the metric definition Advanced section), the events that are filtered out are not included in the metric calculation. Thus, a user key that is filtered out is also not counted in the In treatment value, even though the user key may have been served the treatment.